实验设计

BETE Spray Laboratory


When there are many factors in an experiment, careful selection of combinations of test conditions can reduce the amount of testing needed. BETE works with JMP statistical analysis software to assist with experimental design and data analysis.

Design of Experiments


Design of Experiments is a methodology to plan experiments that extract the most information from the smallest number of tests. Consider a simple example of evaluating the effect of three factors, say temperature, time, and pressure, on a process. You've decided to test two levels of each factor, for example, a high temperature and a low temperature.


One way to run this experiment would be with a "control" case and various "test cases" as follows:

Detail of Design of Experiments Table 1.

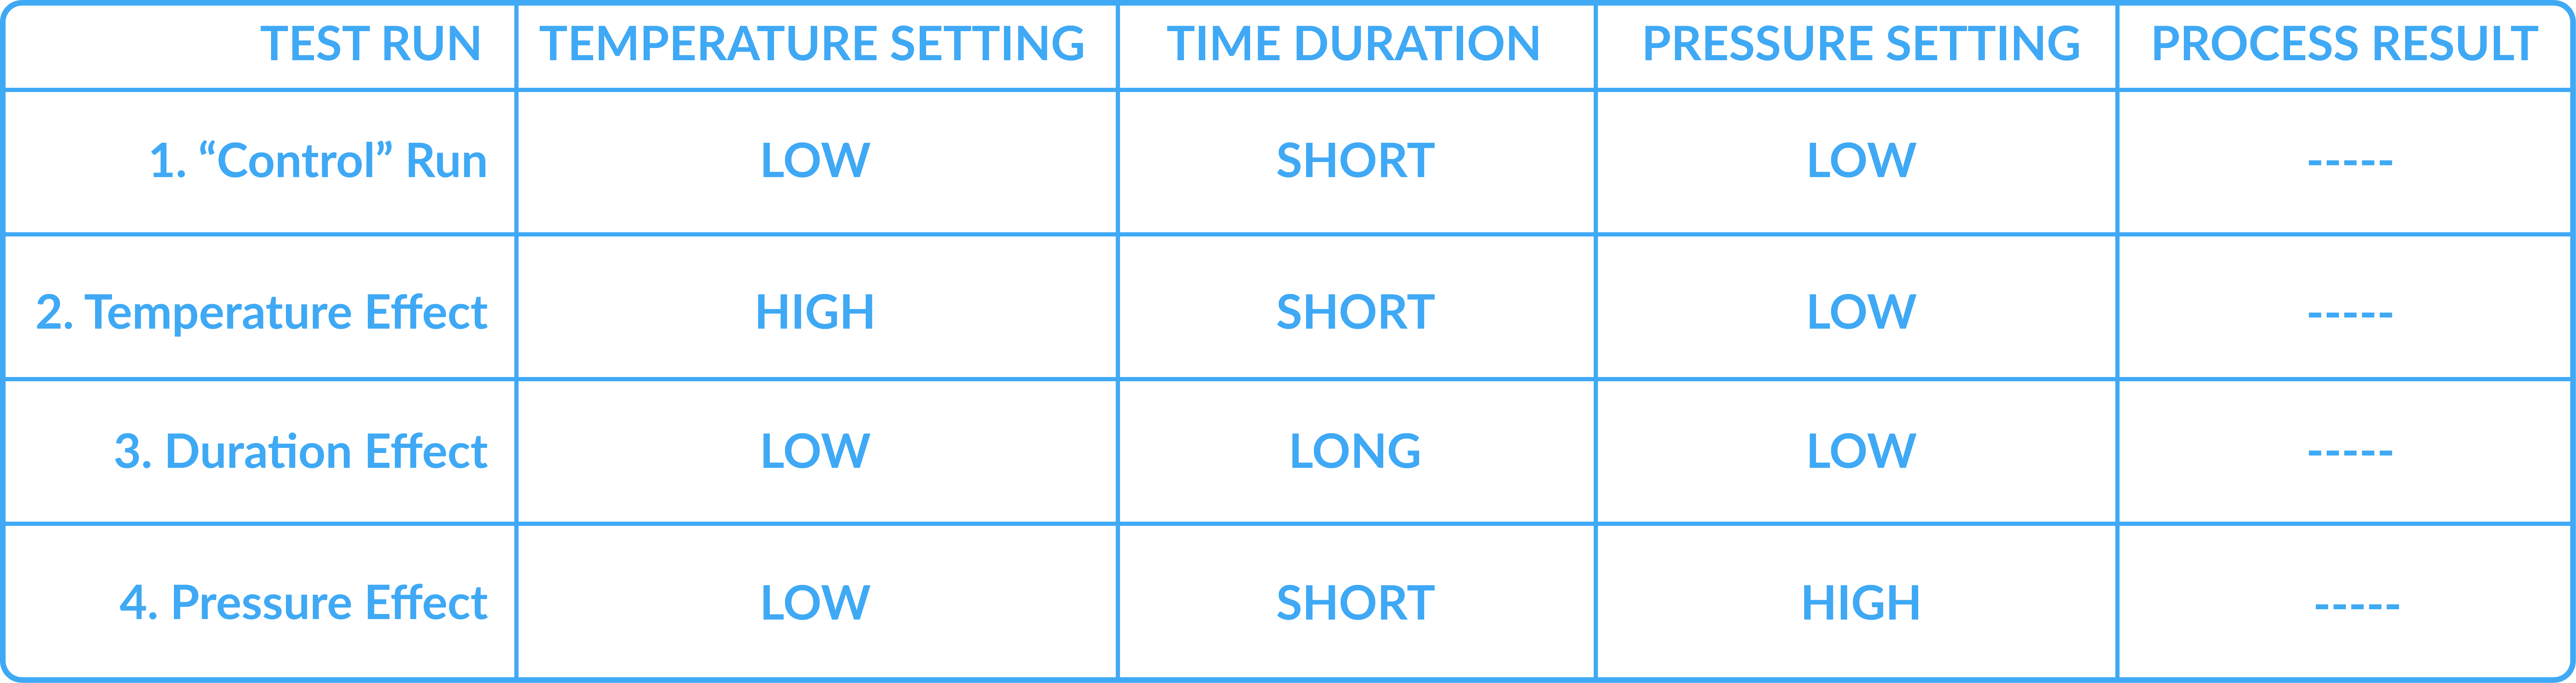
You can use this data to see if the temperature has an effect by comparing the data from run 2 to run 1, ignoring the data from runs 3 and 4. To assess the impact of duration, you compare the data from run 3 to run 1. Doing this is valid, but you use only half the available data in making your decisions for each effect.


Another way to run the experiment would involve testing all possible combinations of the factors in a "full factorial" experiment like this, running all possible combinations of the test conditions:

Detail of Experiments Table 2.

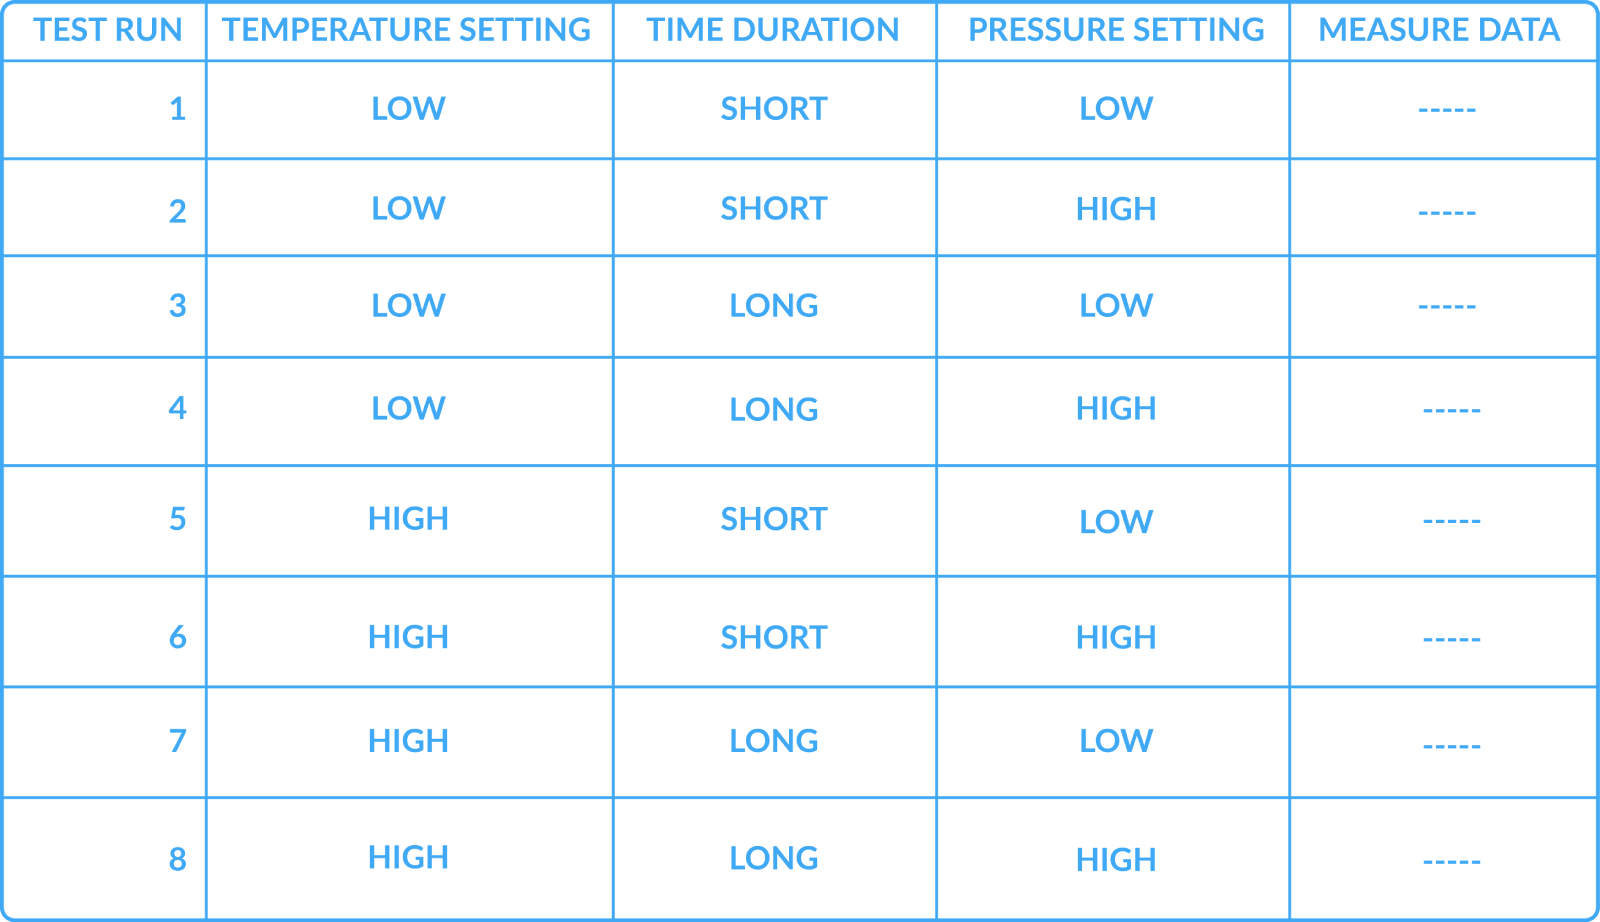
评估建立的影响ure from this data, you could compare the data average from runs 5-8 to runs 1-4.


However, you can get almost as much information as you get with the eight tests by doing only four carefully selected tests:

Detail of Experiments Table 3.

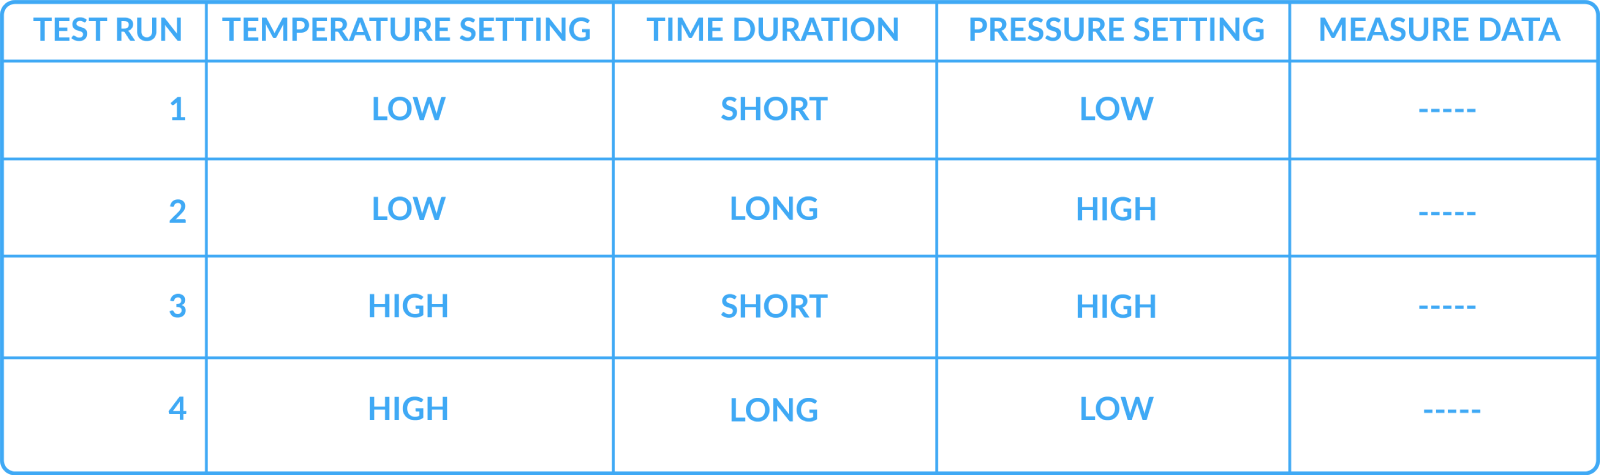
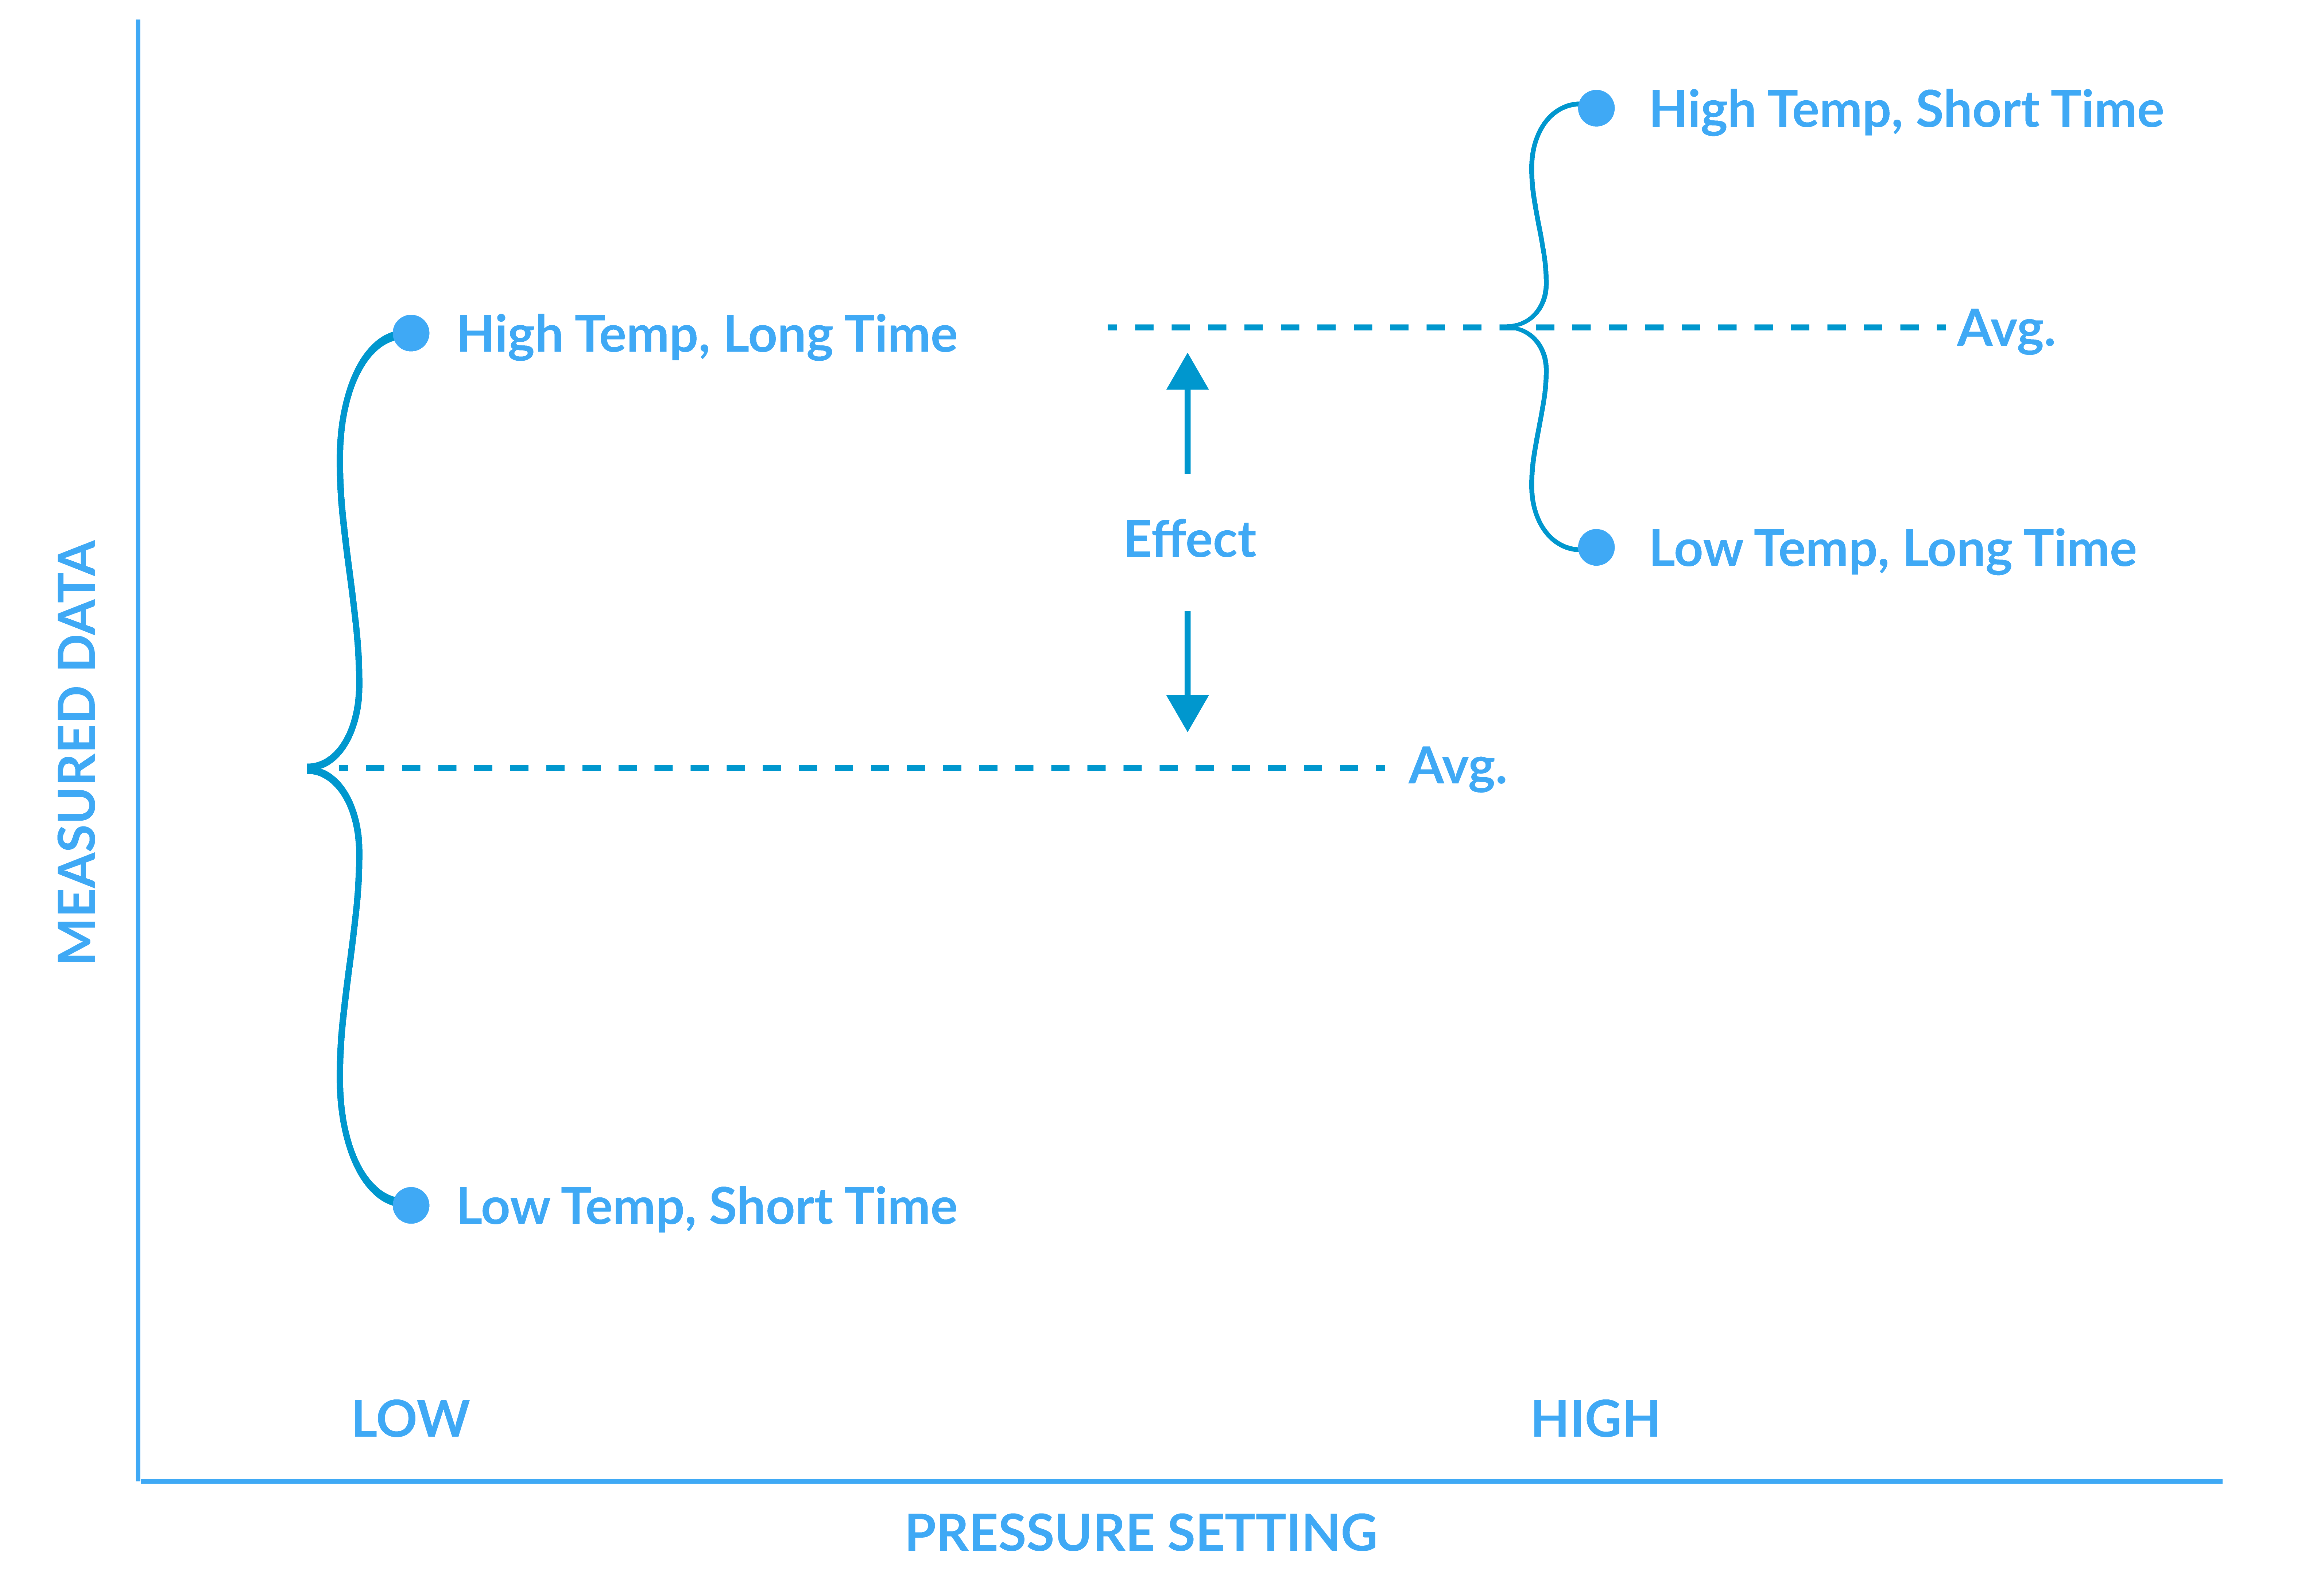
This group of tests represents a "half factorial" experiment, running only half of the possible combinations. When analyzing the data from such an experiment, you compare all the tests done at a low factor setting with those done at a high factor setting.

For example, to see if the pressure has an effect, you compare the data average for runs 1 and 4 against runs 2 and 3. These two groups have data from both temperature settings and time durations, so it is a fair comparison. The data for pressure might look like the following, and from this graph, we could conclude that an increase in pressure results in a larger value of the measured parameter.


Detail of Measured Data and Pressure Setting Graph.
Similar graphs for the other factors of temperature and time would provide insight into the effect of these factors on the process. Reducing the number of tests results in loss of data. We lose data that might reveal an interaction between or among the factors. An example of an interaction could be that the temperature makes a difference only in an extended duration of time. However, interactions may be less important than the main effects, and the time savings involved in doing only half the number of tests may justify some information loss. Knowledge of the process and constraints such as the time and cost to conduct each experiment will guide the researcher to the best experimental design.

Summary


This overview is only a brief introduction to a tremendous discipline in statistics, and there are many other essential considerations in conducting good experiments. BETE uses JMP®software from SAS to assist in the design of experiments and analysis of data. This software helps us evaluate options quickly and explore the collected data efficiently.

Contact Us


Are you ready to see how BETE can help? Let us know what you need by contactingDaniel deLesdernier. We’ll work with you to plan a project that meets your needs and budget.


While, as a matter of course, we maintain confidentiality, we are always willing to negotiate special confidentiality agreements if necessary.